Sentiment analysis in a day with R
Posted on July 24, 2017 • 6 minutes • 1108 words
First of I need to state before I start that I am not a data scientist nor am I any expert in R, so the code in this post should not really be used as a guide.
A bit of back story I been wanting to have a go at doing something that is more data science then some other software engineering project. A good hello world seemed to me was do some Sentiment analysis, it felt a step up from just doing some basic statistics. R was chosen as it has a bit of a buzz around any data science type project with people raving how easy it was to do X and produce some visualisation. So below is my first attempt at learning R and doing a tiny data science project.
The one of the communities I am a part of is called Gamealtion mainly centred around a minecraft server but the chat can be on various topics from music cooking and a rant about something that has annoyed us. For many reason that will not be discussed here the IRC closed down in favour of Discord, This meant that I could get my hands on the last 6ish months of the IRC data before it closed down. This JSON file is 8.6MB and contains around 85k messages. My plan is to do a bit of experimentation in R to work out how to process the messages and see if I can get any useful incites from the data about the community I am apart of.
R and RStudio
With only playing with R in RStudio for a few hours I can not give any in-depth review of the language but I think I may prefer python over R but this may be due to my background in software engineering then science. On of the best bits of R is the libraries that are in built for making visualisations the entire code for this project is only 50 lines long. Another plus over something like python is that although the processing of these messages took 40+ minutes after the script executes the data is still in the session so you can change the visualisation very quickly since you do not have to keep running that for-loop. also since all the variables after the script has finished executing are still in the session you can navigate through the data structures seeing where you went wrong. I can see this being vary powerful any why many data scientist rave about R even after my small experience with it.
Playing with the data
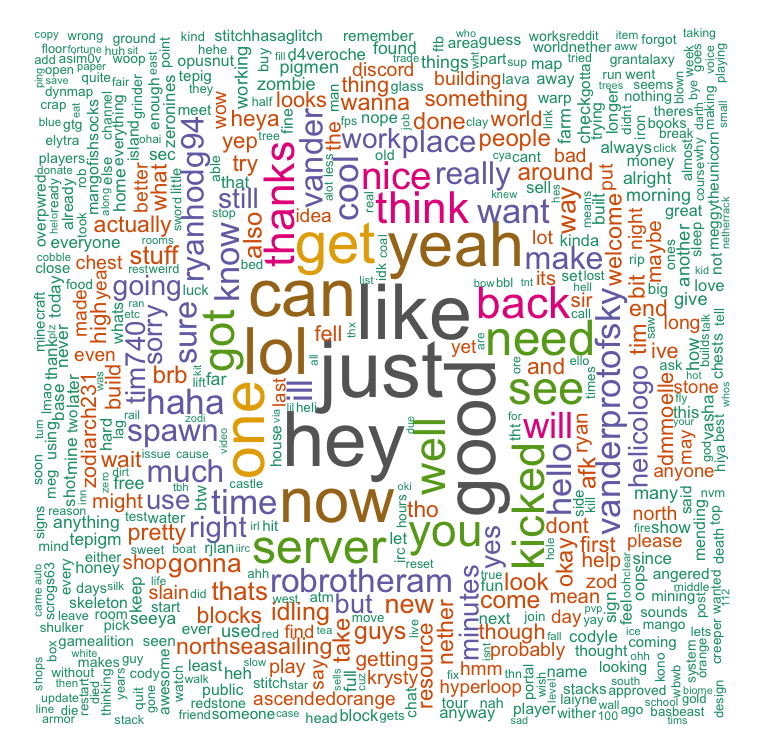
The first part was to generate a word cloud of the data. The first attempt did not go so well, from an example tutorial I found my message clean up function was broken but it did generate an interesting word cloud. After I fixed the function removing messages such as ••• Connected to IRC or ••• **user** joined the channel since theses messages are not really related to any conversation that takes place.
The world cloud is generated by interesting through the message list and after cleaning up the message the text is merged into a single string, the size of the word on the list represents the frequency is used.
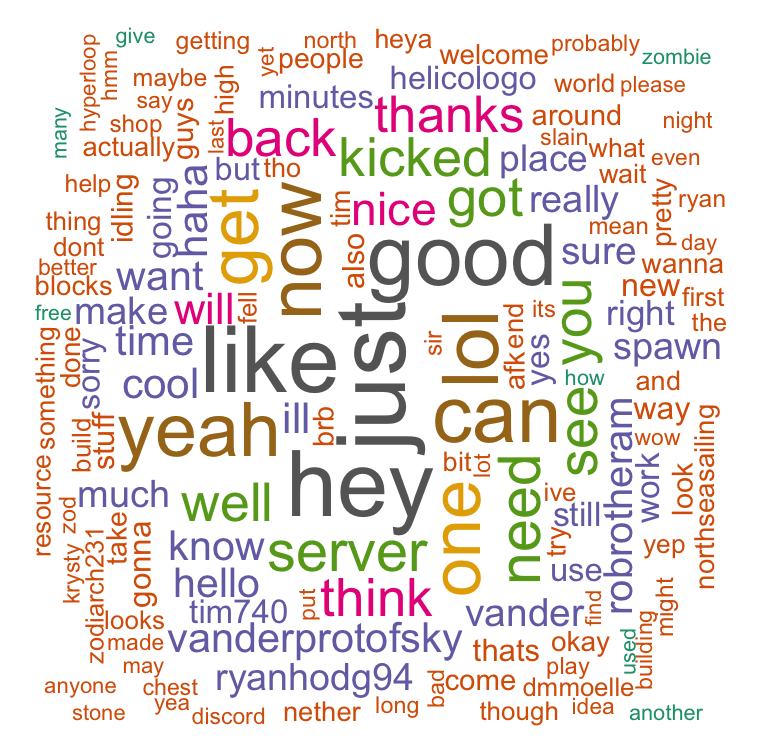
Tweaking the word-cloud settings increasing the number from 150 to 1000 words to plot. From the world cloud it interesting what the common words words used. As you can see the most common words are like “hey”, “good”, “yeah”. It is interesting in the usernames that the word cloud has picked up. Since the message contains game messages (that should be filtered out) it will also include when someone joins or leaves the game server. This side-effect has allowed us to see the most active people in the game.

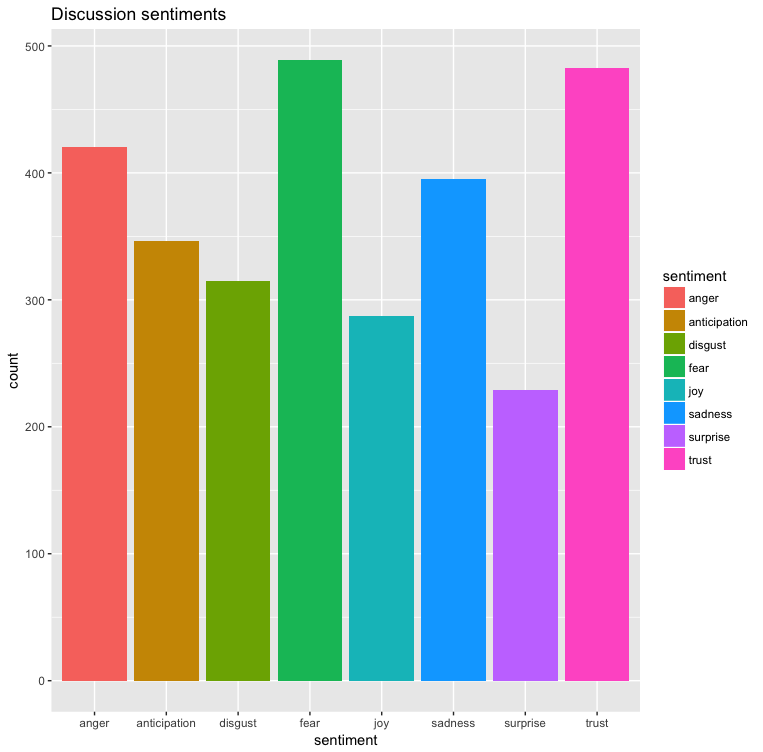
The next step after producing the word cloud was to producing some sentiment statistics on the message data. From another tutorial I went through suggested using the syuzhet library since the sentiment library was deprecated. This library rates the message into the following categorises:
- anger
- anticipation
- disgust
- fear
- joy
- sadness
- surprise
- trust
The first attempt was using the full message string, ie the same one that is used in the generation of the word cloud. The results are not useful since the results were fairly balanced across all the categorises which does not fit with the word cloud result
The second attempt was to generate the results per message and then sum all the categories and generate the result. This looks more promising, the positive messages is almost double the negative results. Also messages trend to more positive direction with the categories anticipation, joy and trust outweighing fear and sadness.
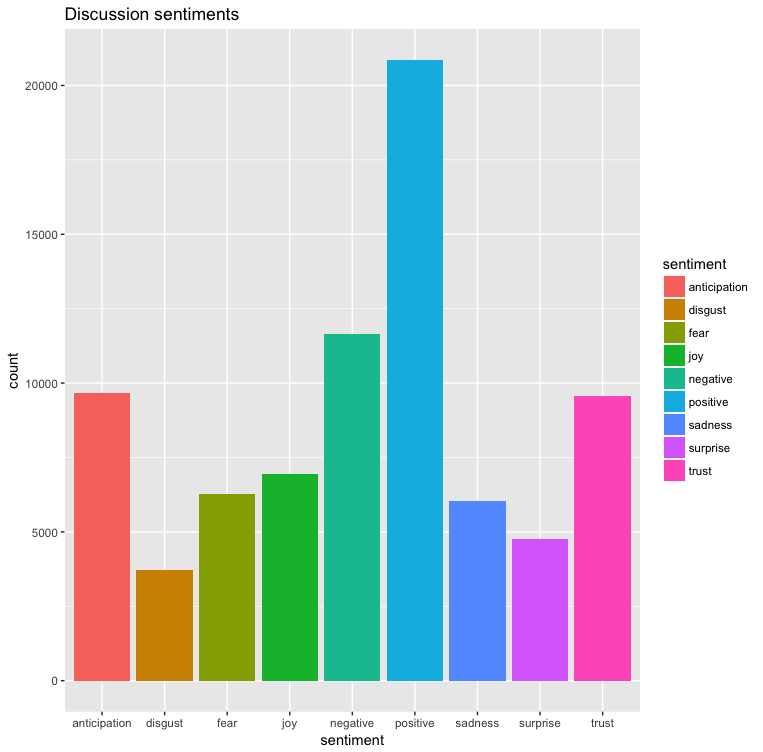
I think the main reason for the larger negative messages are that I am still keeping in-game messages so this dataset of messages will contain when a player dies in game along with people mentioning this death with messages like RIP
Comparing the word-cloud (the 1000 most commonly used words in the chat) and this sentiment analysis I think I can safely say that I am a part of of a fairly positive and trusting community and after participating in the IRC channel for a long length of time I can say that the this data does correlating with my experience.
The Code
Below is the R code I used to generate these visualisations. As I said at the start I am very new to R so I am sure there are way better ways to process the data. It took 40+ mins for the Code to execute the for loop to iterate over the 85k messages, not sure if there is a better faster way to do this or if it just a limitation of R and the data should be processed in python first to get it into a better data format.
library(jsonlite)
library(httr)
library("stringr")
library("wordcloud")
library(stringr)
library(tm)
library('syuzhet')
library("ggplot2")
clean.text = function(x)
{
  x <- gsub('<(.+?)>', '', x)
  x = gsub("^  ", "", x)
  x = gsub("^•••.*$", "", x)
  return(x)
}

#get data
json<- fromJSON("json URL")
data <- json$data[[1]]
#check it works
test <- clean.text(data[[1]]$m)
print(test)

txt <- ""
total <-get_nrc_sentiment(test)

#combine all messages into a single string for word clound and compute Sentiment analysis per message
for (name in names(data)) {
    test <- clean.text(data[[name]]$m)
    txt <-paste(txt, test, sep=" ")
    total<- rbind(total,get_nrc_sentiment(test))
}

#Clean UP
vector <- paste(txt,collapse=" ")
remwords <- c("joined","game","left")
vector <- removeWords(vector,c(stopwords("english"),remwords))

#Compute WordCloud
wordcloud(vector, scale=c(5,0.6), max.words=150, random.order=FALSE, rot.per=0.35,colors=brewer.pal(8,"Dark2"))

#sum all analysis
sumT <- colSums(total[,-1])

#Format data frame for plotting
data <- data.frame(colnames(total)[-1], sumT)
names(data)[1] <-"sentiment"
names(data)[2] <-"count"
print(data)

#Generate Plot
plot <- qplot(sentiment, data=data, weight=count, geom="bar",fill=sentiment)+ggtitle("Discussion sentiments")
print(plot)
```