
Managing and documenting my home-lab with Mist.IO, Netbox, Guacamole New ELK Stack
Posted on January 7, 2018 • 7 minutes • 1426 words
As you might have noticed over the past year at my homelab progression is that I have a strange fascination with orchestration platforms such as kubernetes openstack or mangining a collection of virtual machines. Some people enjoy the use of these platforms on how easy it is to get a large application working across multiple machines. My fascination goes down the depths of how it works and how to set up all these orchestration platforms.
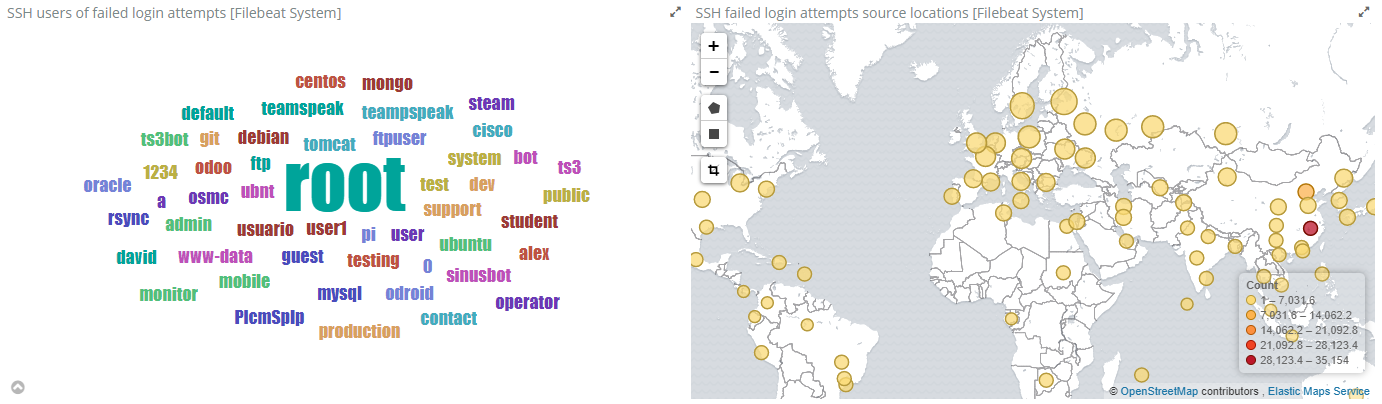
My current Homelab setup is only has one bit of tin, a HPDL380 G7 Server, it is a fine bit of tin but since it is only one server its a bit impractical to use something like openstack which really needs 3 machines to run properly. But I do have several Virtual machines running on it, some for experimenting others that run the infrastructure like the monitoring and gitlab servers. I have mentioned before here the how I currently use a combination of prometheus and grafana for visualizing all the metrics. But over the Christmas break I expanded the setup with adding in a new Elastic/Kibana/Beats monitoring setup. This is to add more detail log information from all the various servers I have running. So while Grafana/Prometheus gives me a the real time performance (CPU, Memory Hard Disk space) The ELK Stack gives me details on log type information such as the locations of failed ssh logins and the usernames that are common to the attack
The setup of this new monitoring system was very simple. In Elastic/Beats versions 5+ they have been adding in the log parsing into elastic rather then using logstash. so when previously you had to write custom parsers in logstash to ad geoip information from ssh that is done via the beats plugin and the elastic database.
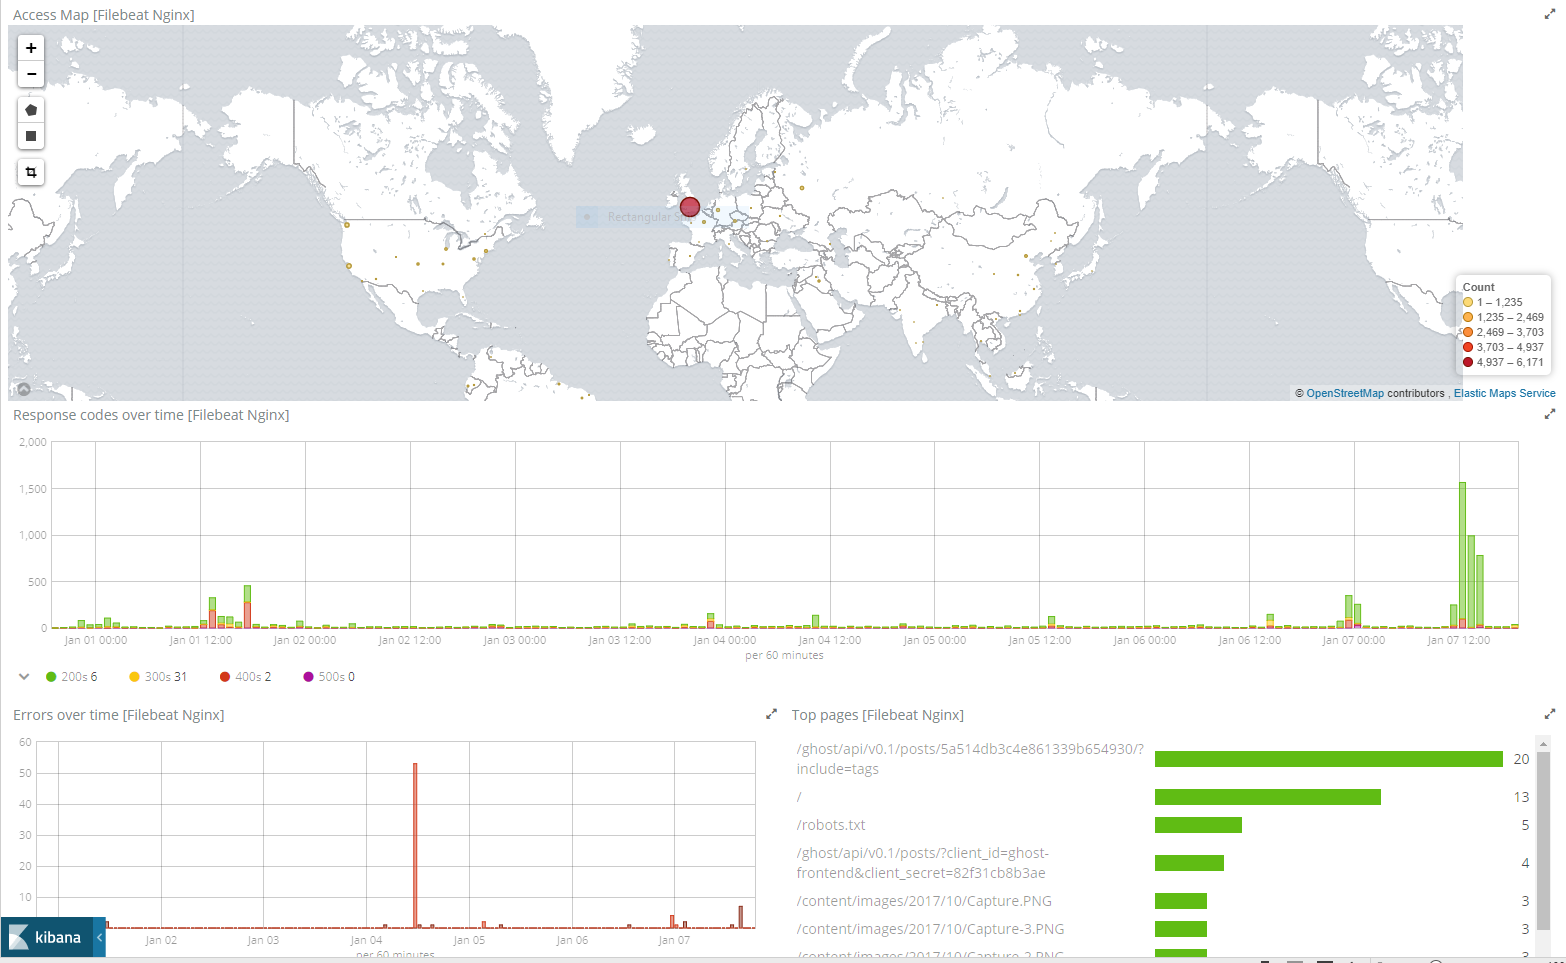
One of the other changes I made by removing logstash is that I do not need to add some crazy iptables rules to the Raspberry Pi (PC that at the end of the vpn tunnel see diagram below). I just add some simple http proxy redirects to the nginx server to forward all requests from the Virtual Private Server (VPS) I have hosted on OVH into the elastic database simple. So on the VPS I have metricbeat, packetbeat and filebeat that send all the metrics down the VPN tunnel into my homelab for it then to be forwarded on via the nginx reverse proxy.

Monitoring of all of this new metric information is done in kibana, when previously you had to build woiyu own custom visualizations and dashboards or find a uptodate version that matches the index you created in logstash was difficult. Now all of the beats have scripts that can connect to kibana directly and will create the visualization and dashboards automatically.
So a system that would have taken couple of days to setup configure all the plugins parsers and dashboards can now be setup in a matter of a few hours for a simple setup.
The both dashboards all the ssh attacks in the past week (above) and the one showing the nginx access map (below) were created by the filebeat plugin
Netbox
With the new monitoring out of the way we can move on to documentation. I a few places I have worked where I have been involved even briefly seem to use a collect of ad hoc methods for documenting the network infrastructure. Good documented system seems to mainly mean a collection of spreadsheets with ip address noted down with possible links to confluence for documentation with a diagram that may not be updated created in something like visio.
On my continuous search for new interesting projects I came across this small project from Digital Ocean called Netbox from there own documentation
NetBox is an open source web application designed to help manage and document computer networks. Initially conceived by the network engineering team at DigitalOcean, NetBox was developed specifically to address the needs of network and infrastructure engineers.
One of the biggest problem I found with a system that is mainly spreadsheet based on networks is that when something goes wrong there is no search you have to backtrack the fault to a point that correlates to something found on the spreadsheet. This is where the NetBox.
Since it’s designed around engineers it contains more than just network information it based around a rack that will have PDU’s network switches and the Servers will be hosting many virtual machines NetBox can capture all of this. Since it comes from Digital Ocean for there internal use it has support for massive organizations that may have multiple sites and regions to separate the compute power
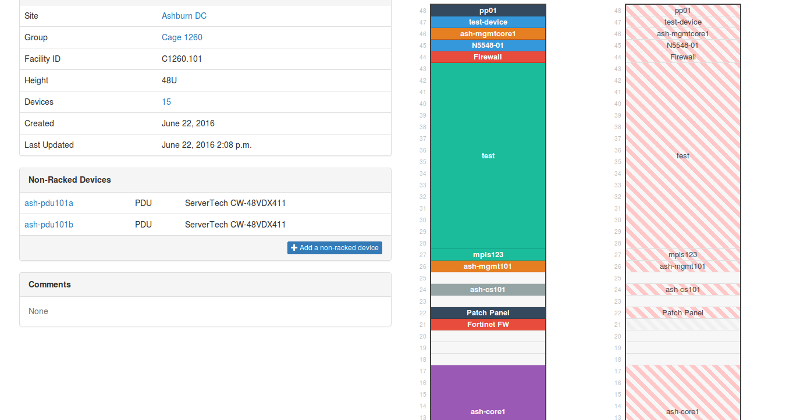
I have only started using is and my setup of 1 server 1 switch and a few VMS all on a single subnet I can generally remember and visualize my infrastructure in my head and anyhow I am the only who will ever need change it. But It will be a tool if I get involved into any future projects at work to keep in my back pocket as a documentation tool.
Mist.io
A tool I been on the search for is effectively a web frontend to manage KVM. I know of tools such as proxmox but they have their own hypervisor and I like managing mine with Libvirt. As I have previously stated tools like Openstack that can use Libvirt are too big for my current needs. I have previously tired to create my own (see here) but I do not have the time to invest in that tool to make it as stable as I would want. a year or so ago I came across Mist.io which looked interesting and promist that it had support for libvirt but at the time it looked that it was completely a hosted solution and I do not want to trust a 3rd party to have ssh access to my infrastructure no matter how much they say about security.
But I found out recently that do know have a community edition that is self hosted and in docker containers yay! So couple of commands later and boom a self hosted Mistio with all my VMS and Containers listed, god I love the power of docker.
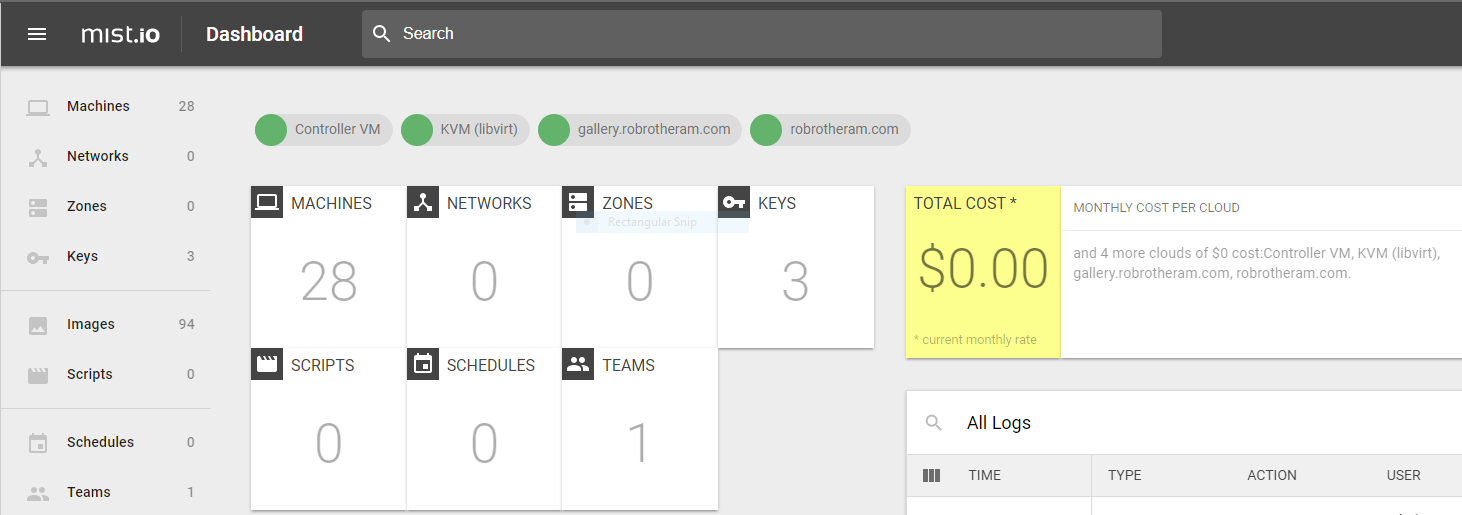
Since its designed with multiple clouds in mind it looks like it be a great tool for hybrid cloud solutions. I can monitor my internal infrastructure with plugins for docker libvirt and openstack, it also can connect to clouds such as AWS Azure and GCP. For the Clouds it can get the total cost which is displayed in the dashboard.
In the community edition it also has a feature for running scripts with schedules so a simple stuff like backups and reboots or updates can be done via this tool instead of something like ansible or puppet which is its own rabbit hole that I should investigate sometime soon.
Guacamole
One of the things that Mist.io does not have support for is web based kvm into the virtual machines. It does have simple console support but for things like Windows or a linux Desktop you need a full vnc/rdp solution. Guacamole has been around for ages and many organisations already use it. But I thought I try it out I only have 1 machine that has a desktop since all the rest are just servers.
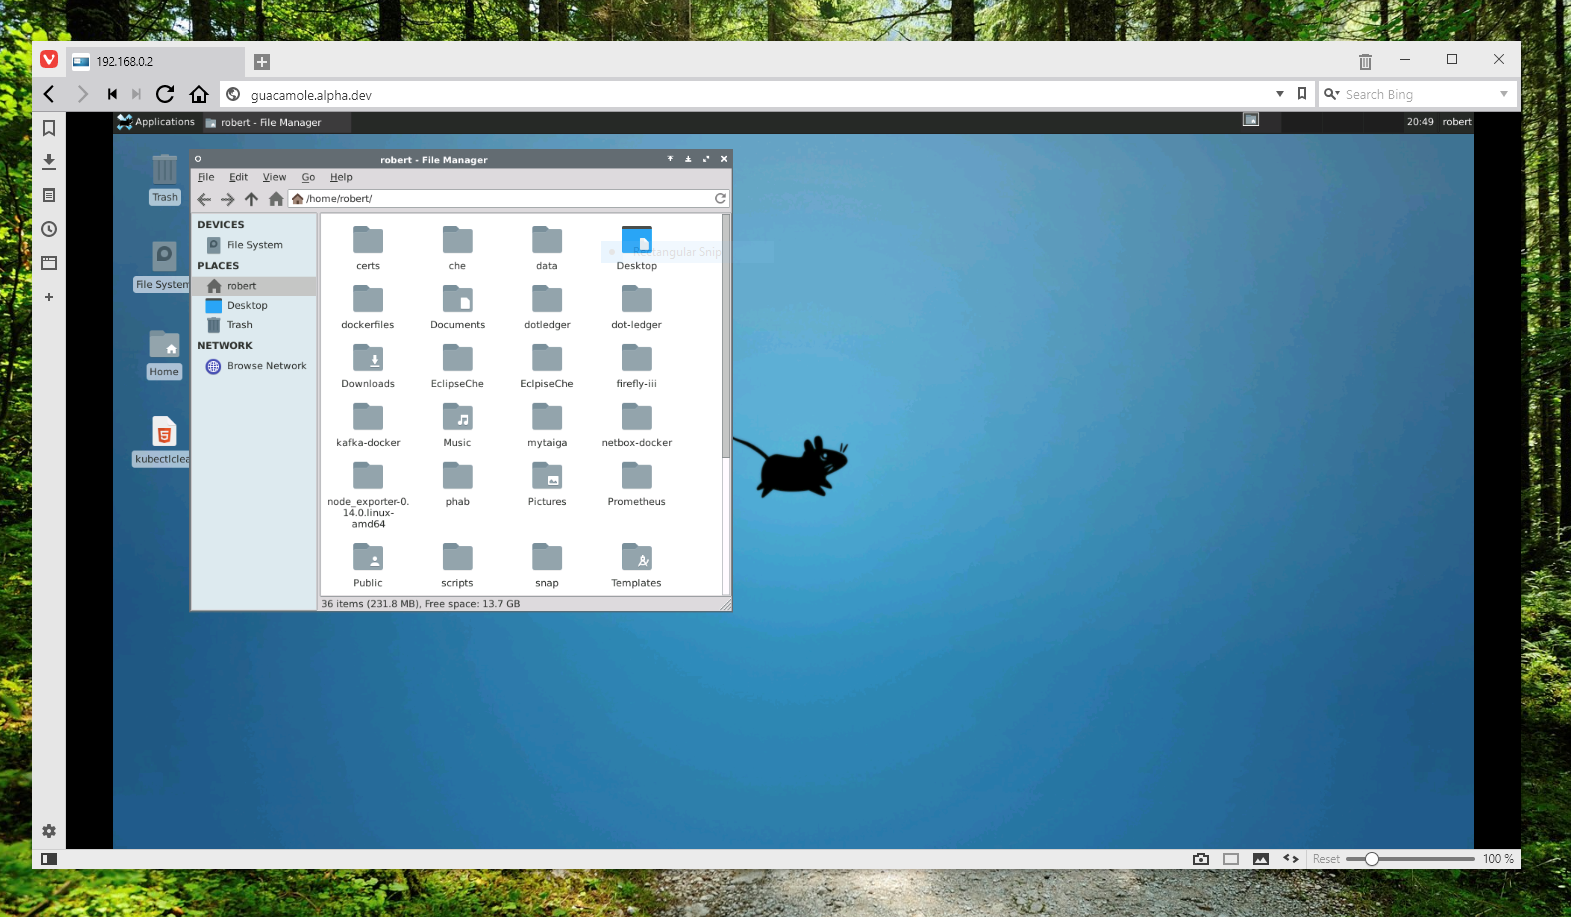
I did try and get it to connect to my windows desktop but with know luck but I know windows 10 increased the RDP Security so there may be some setting that I need to change in Guacamole to get windows to work but that is really not my concern since I really don’t want anyone connecting to my PC one of the main reasons for having Windows 10 pro is the limited adware that on it.
The System works OK but like anything I think if you are using it to do minor changes in active directory on windows server that It be good for that but for any work I would not use it since it slow and things like firefox takes a good bit of time to load due to all the compositing steps along the pipeline that needs to get done. For remote desktop I use a desktop application such as X2Go windows RDP or NoMachine or for something completely different if its programming use web based tools like Eclipse CHE or Jupiter Notebook.
Well that’s all the stuff I played around with over the past month over christmas hope it’s been interesting it certainly been for me.