Elastic{ON} 2018
Posted on June 5, 2018 • 8 minutes • 1501 words
Summer 2018 and I am back on a train from conference on Elasticsearch and the solutions it provides.
I writing this on the train back from a jam packed conference put on by Elastic about all things Elasticsearch and solutions it provides. It is the second time I went to this conference going to one the previous year. While the last conference I went to was about the massive changes between version 4 and the newly released 5, including all the big improvements around upgrading and the re-engineering around Kibana. This time it was less about what has fundamental changed in elastic and more about what can elastic due for you.
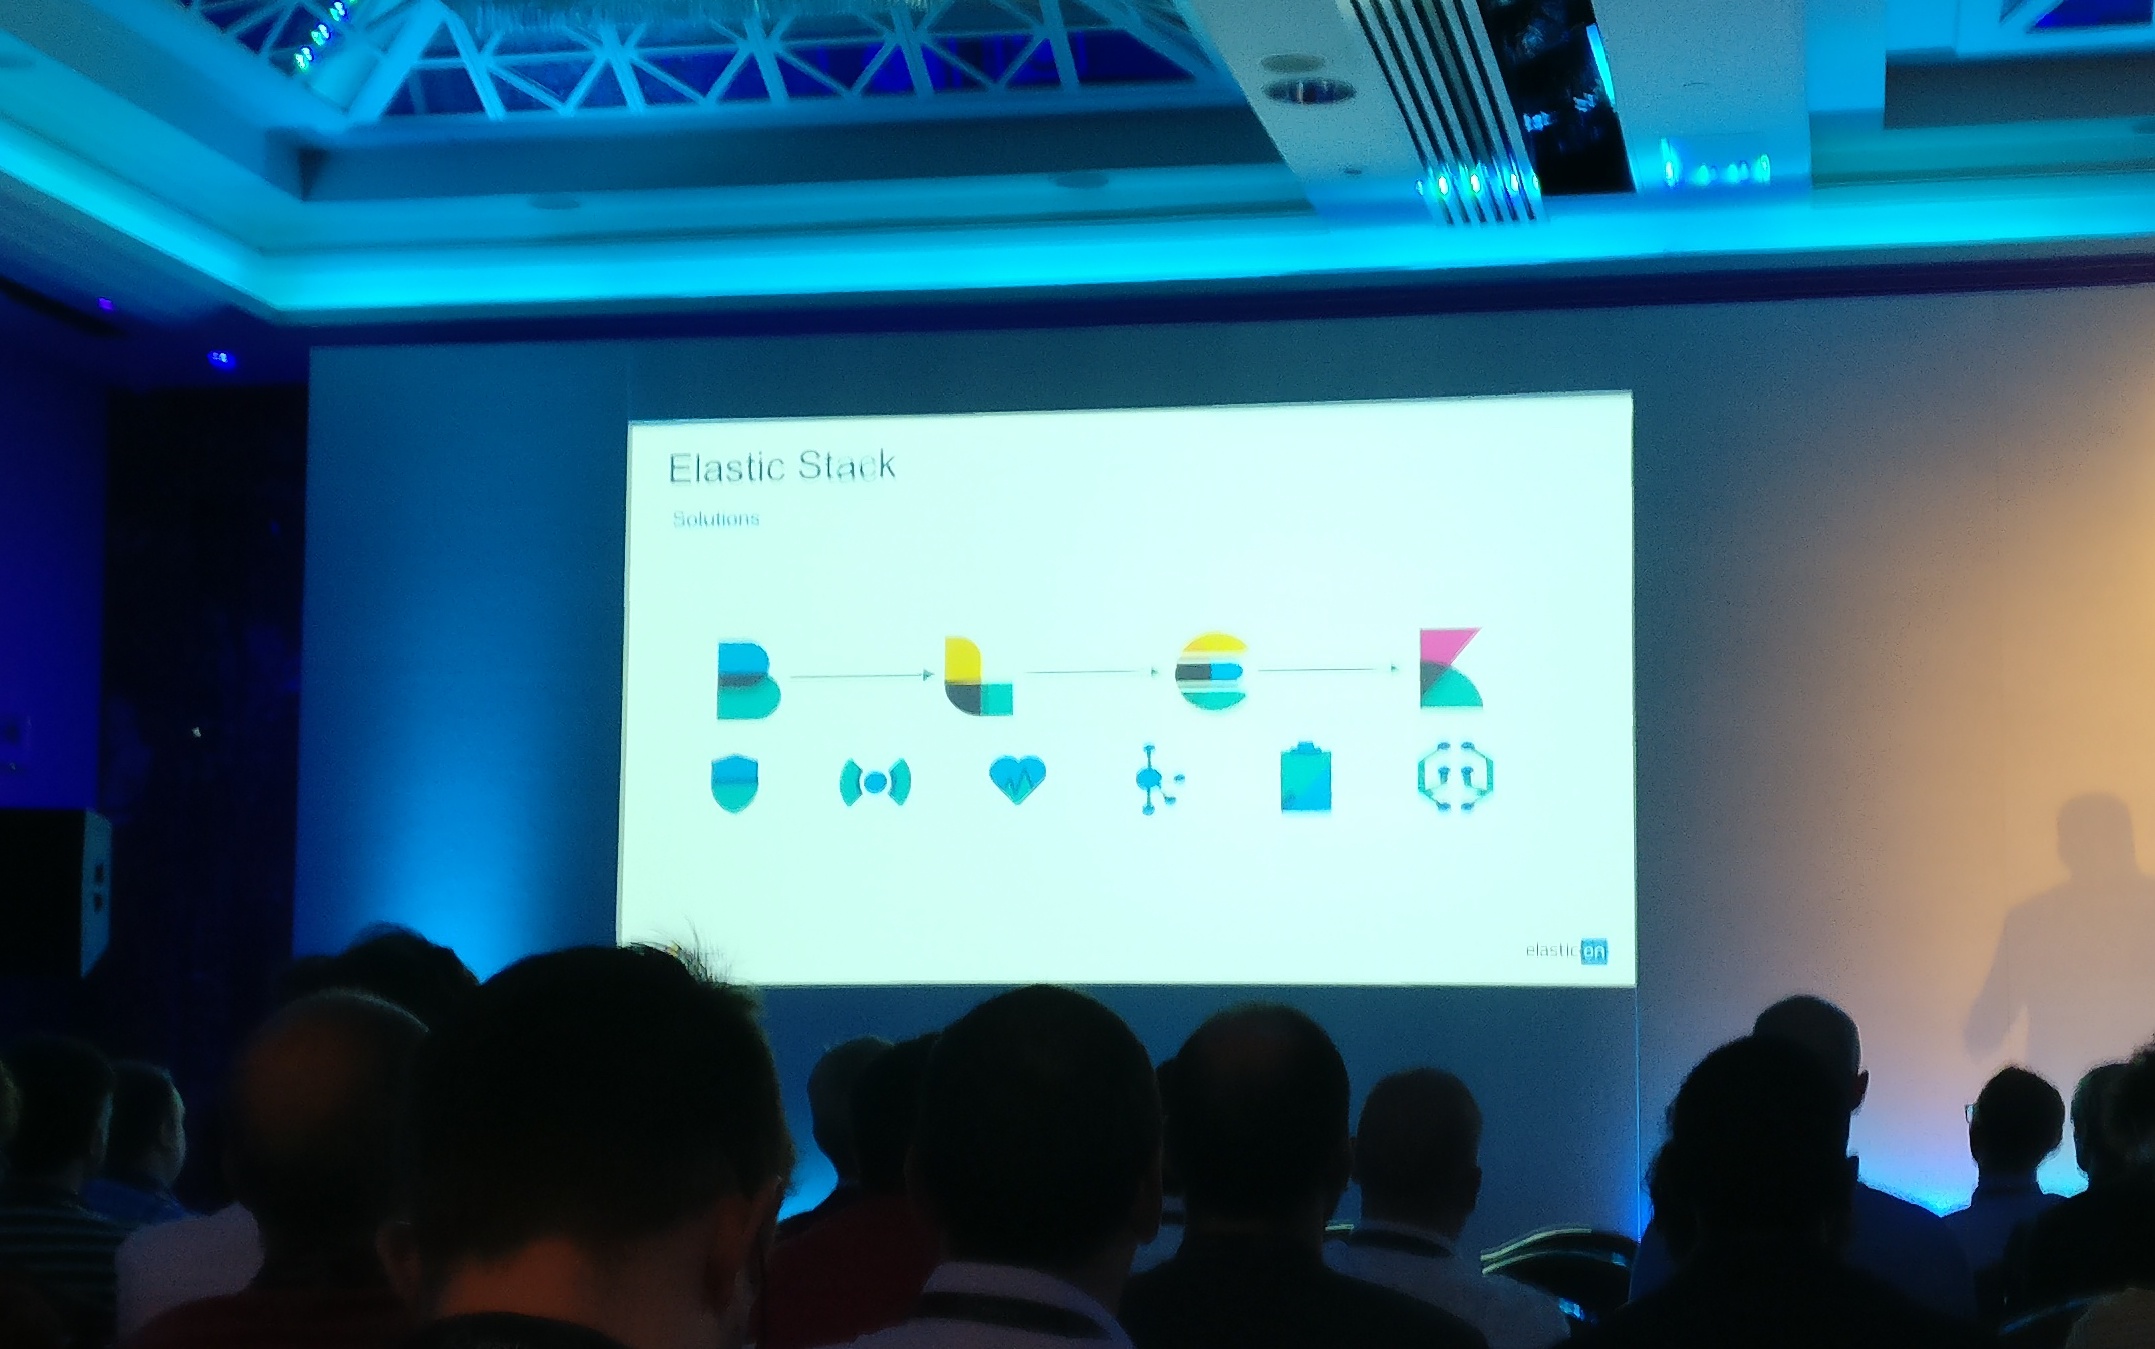
Elastic for a long while has been the default stack when talking about logging for you infrastructure. Chuck all your files at Logstash let that parse and enrich them with multiple pipelines e.ge geoip and dump them into elastic where you can view the resulting logs in kibana and drill down to find errors.
In the past few years with a mixture of building and acquiring various products elastic have created a full sweet of tools that can collect various forms of data. From previous years they have already had filebeat (for log files and syslog) and packetbeat (network data, dns ip etc) but have expanded to having health and metricbeats for health and system metrics of the infrastructure. New is Auditbeat which can listen the the audit bus on linux for all audit based events. Elastic have also moved into the APM space having a set of libraries that will audit node and python applications with Java and Golang in Beta.
This means for the first time you can monitor everything from user requests through to system and network data in one tool and it is fairly trivial to have a dev system to test setup. Literary during the opening keynote while keeping notes on the keynote I created a new VM on my cluster installed docker and spun up a full cluster with all the beat plugins thanks to this compose file from elastic (https://github.com/elastic/stack-docker)
What are the solutions Elastic are hoping you use their tools to solve? Well effectively any space you can think off. But there focus is still heavily in the logging and metric space but ever since the announcement that Google site search for enterprise is being retired. Elastic are hoping that you switch to them. Most of what google offered in their product you can do with elastic things like page arrogation of search and things like fix spelling and grammar mistakes in the queries that you send them.
Another big push which includes their new and improved machine learning aspect is the move to push into the SIEM space. For those not in the know SIEM stands for security information and event management and they are the tools used in enterprise to keep a track of what is happening on the network and raise alters for everything like unusual behaviour to network attacks. In this space elastic have 2 offerings. One is a set of Logstash pipelines to help ingest logs from existing SIEM tools such as Arcsight https://www.elastic.co/guide/en/logstash/current/arcsight-module.html https://www.elastic.co/arcsight
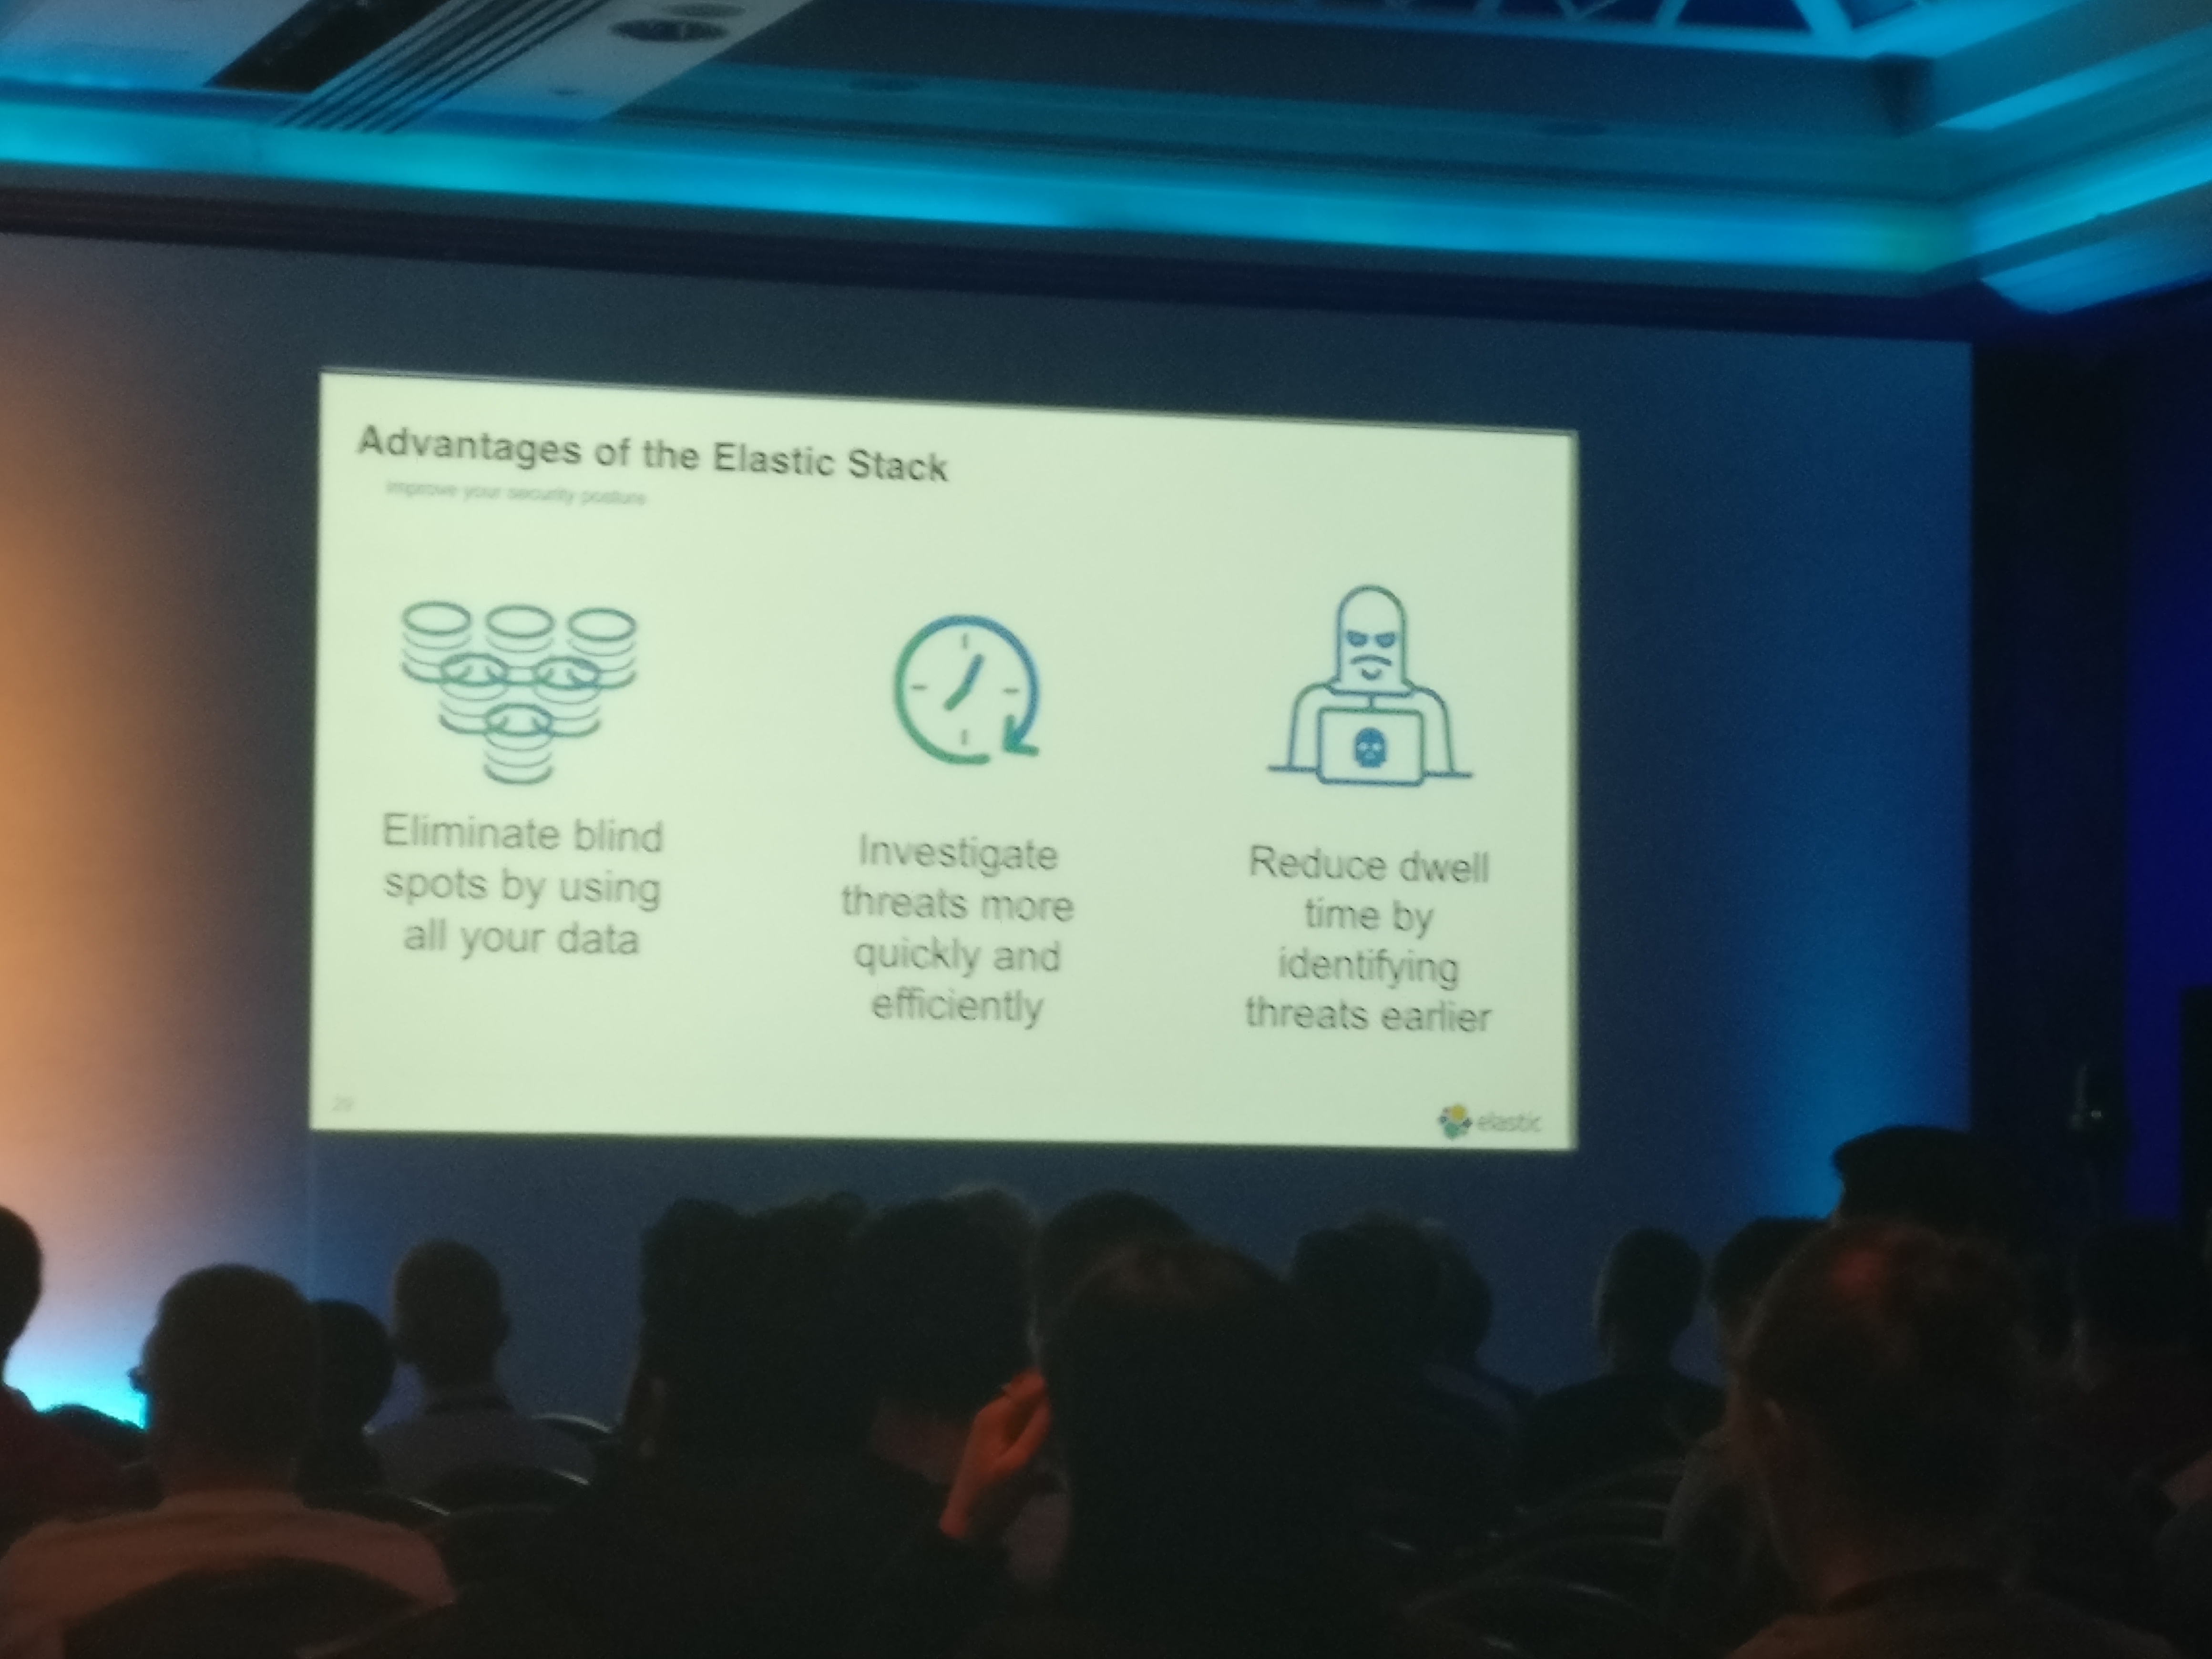
During the conference they were pushing another solutions. With all there beats offerings you have a way to gather all the metrics you need from low level system metrics logs and network data to user windows logs (thanks to winbeat) all the way up to application data. By duping this data into elasticsearch the analysis have the full power to drill down through all the data fast (millisecond fast), have all the enrichment of that data ( e.g geoip) and with the power of Machine Learning altering events can be way smarter. One of the problems with SIEMS are the fact that they are rule based and there database is not suited to querying over vast multi-dimensional data fast. Also since they are rule based it takes a long time for one to get the all the rules in places and they can generate a lot of spam alterts since the system does not know what normal looks like. IE Monday morning might have a huge spike in traffic as an entire company comes in turns on the computers and receive 2 days worth of emails updates and other data form the servers. Using Elastic ML it can learn what the normal behaviour is and then start generating events based on abnormal behaviour. Elastics Watcher tool can then based of these alters do multiple things.
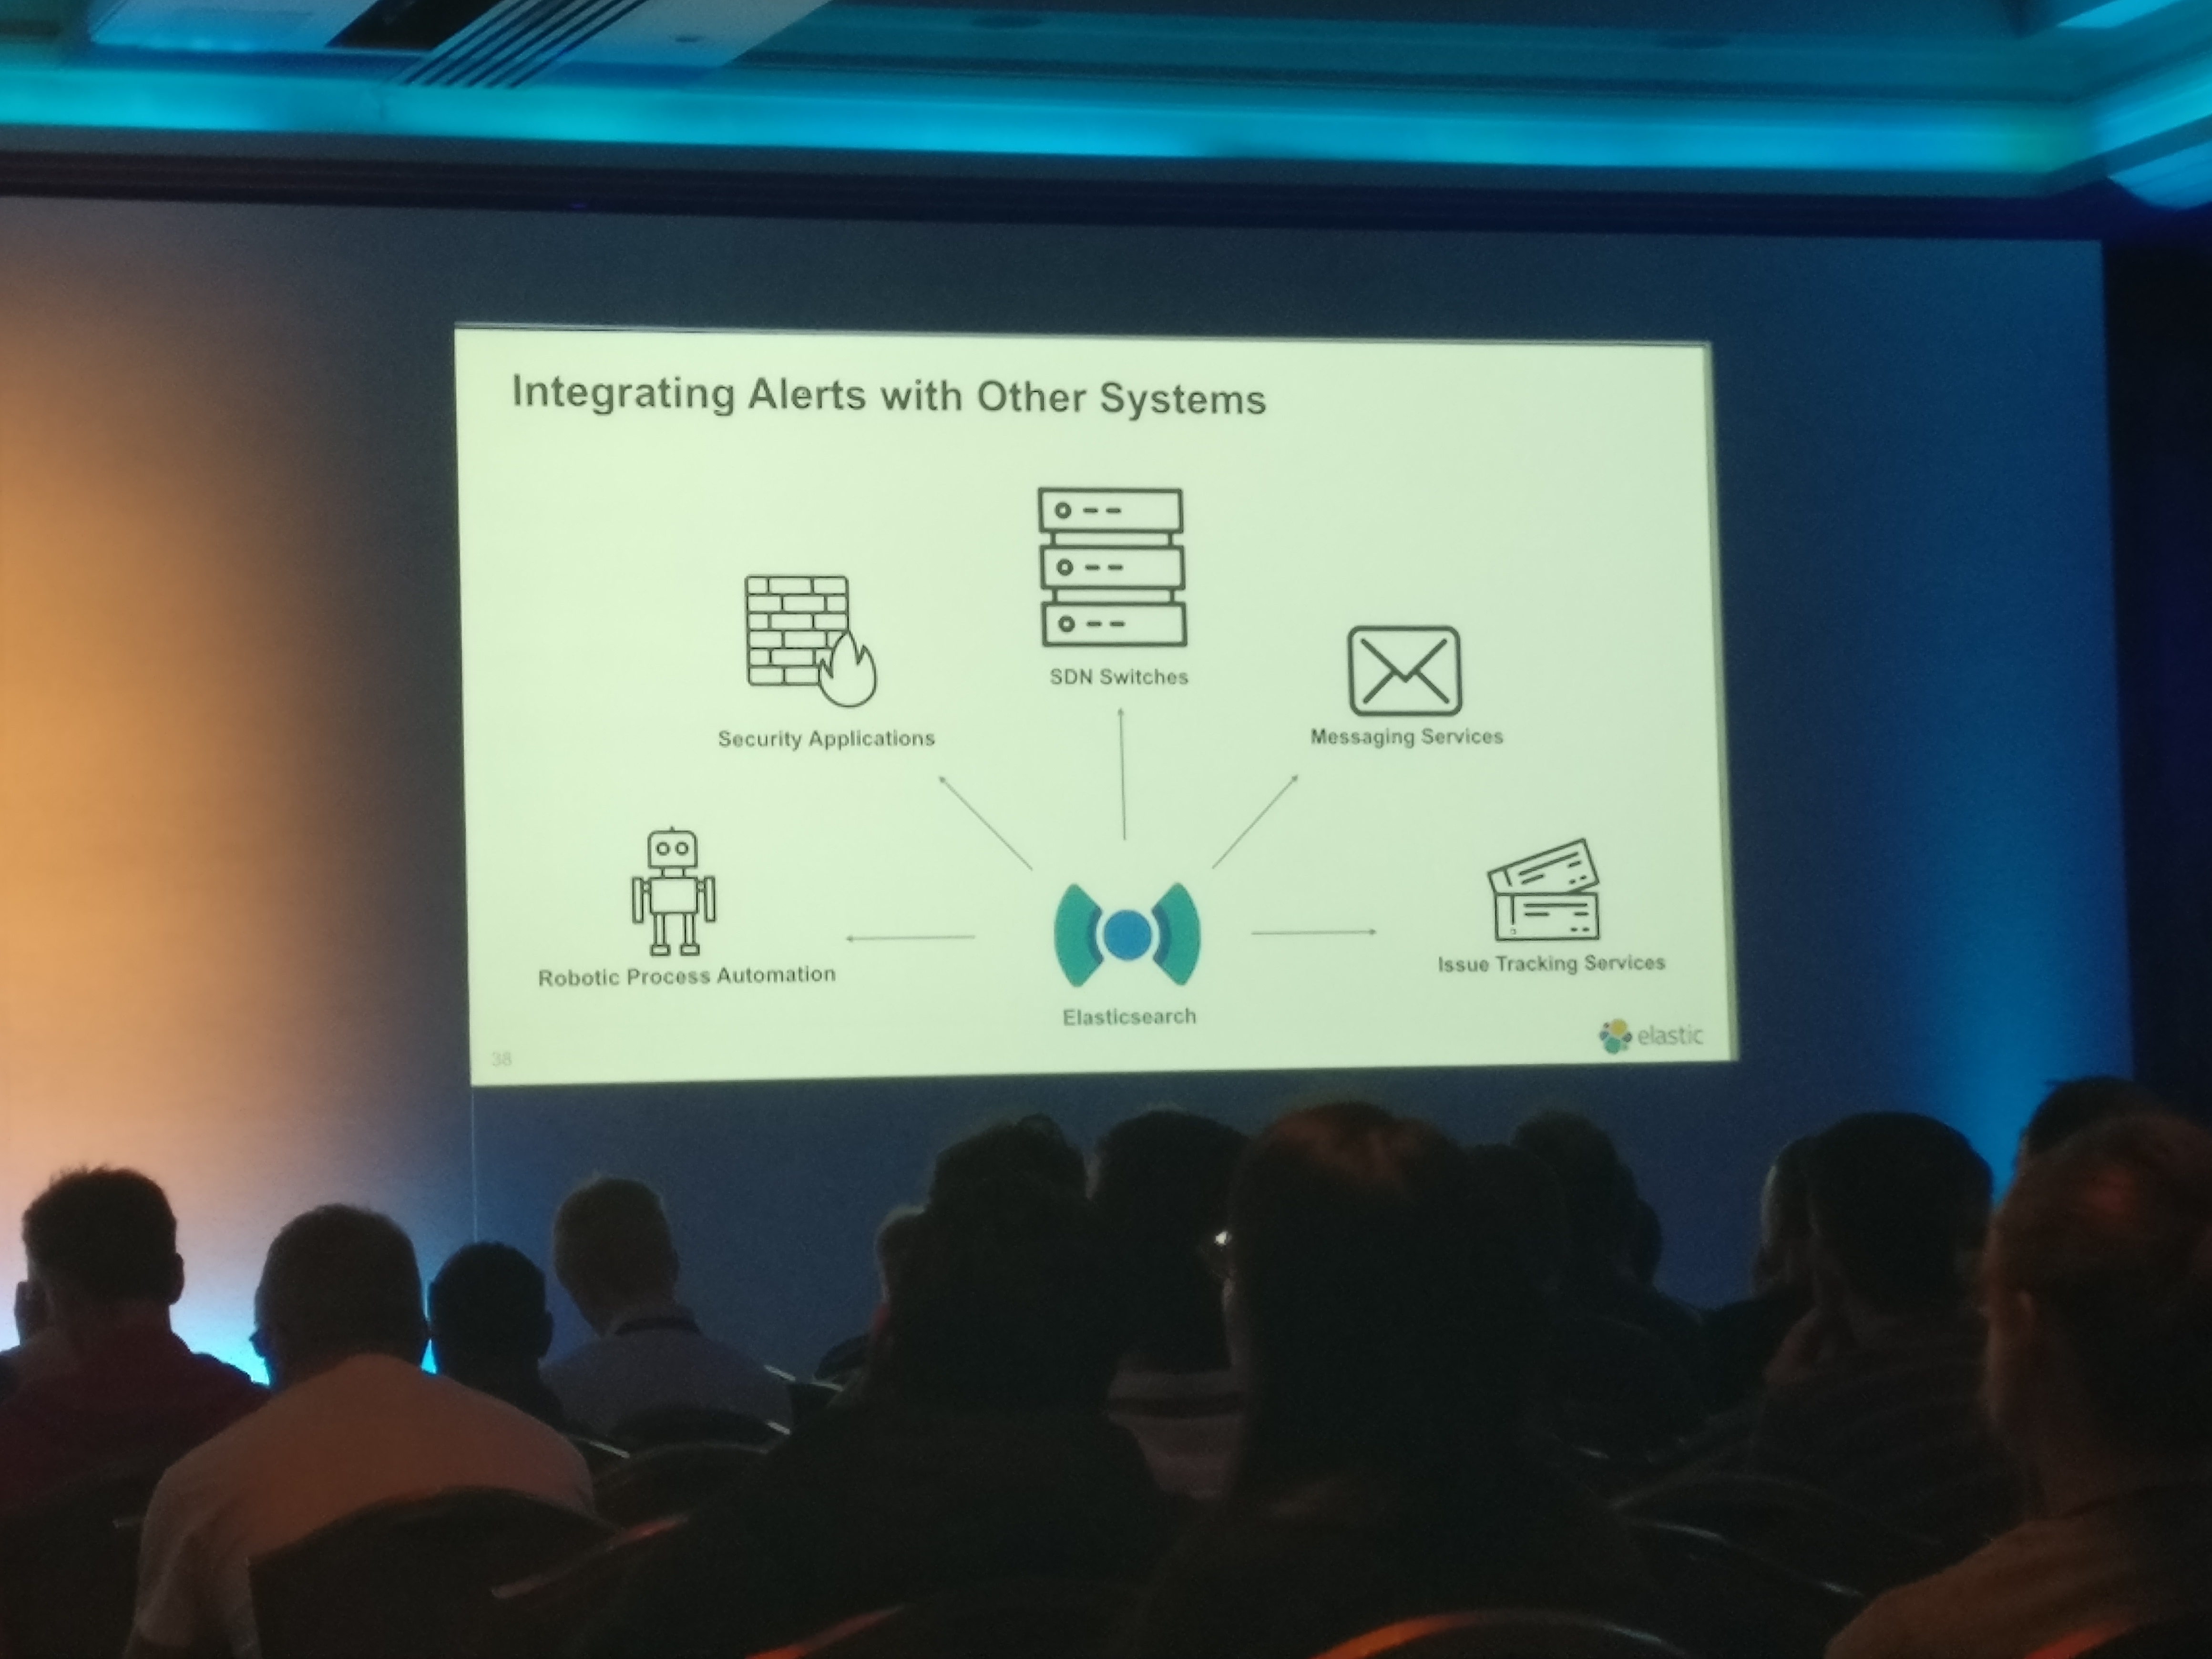
One of the new features that was presented at the conference was the ability to use webhooks. This allows it to do all sorts of things based on what webhooks it can talk to. I could create tickets in tools like Jira or control a firewall rules based on the configuration on the firewall. I this case using Elastic in-place or along side a SIEM tool you have everything from Event collection enriched data for analysis to search over, smart alerting based on behaviour of the system and have a combative ability based on what you have configured the webhooks to do.
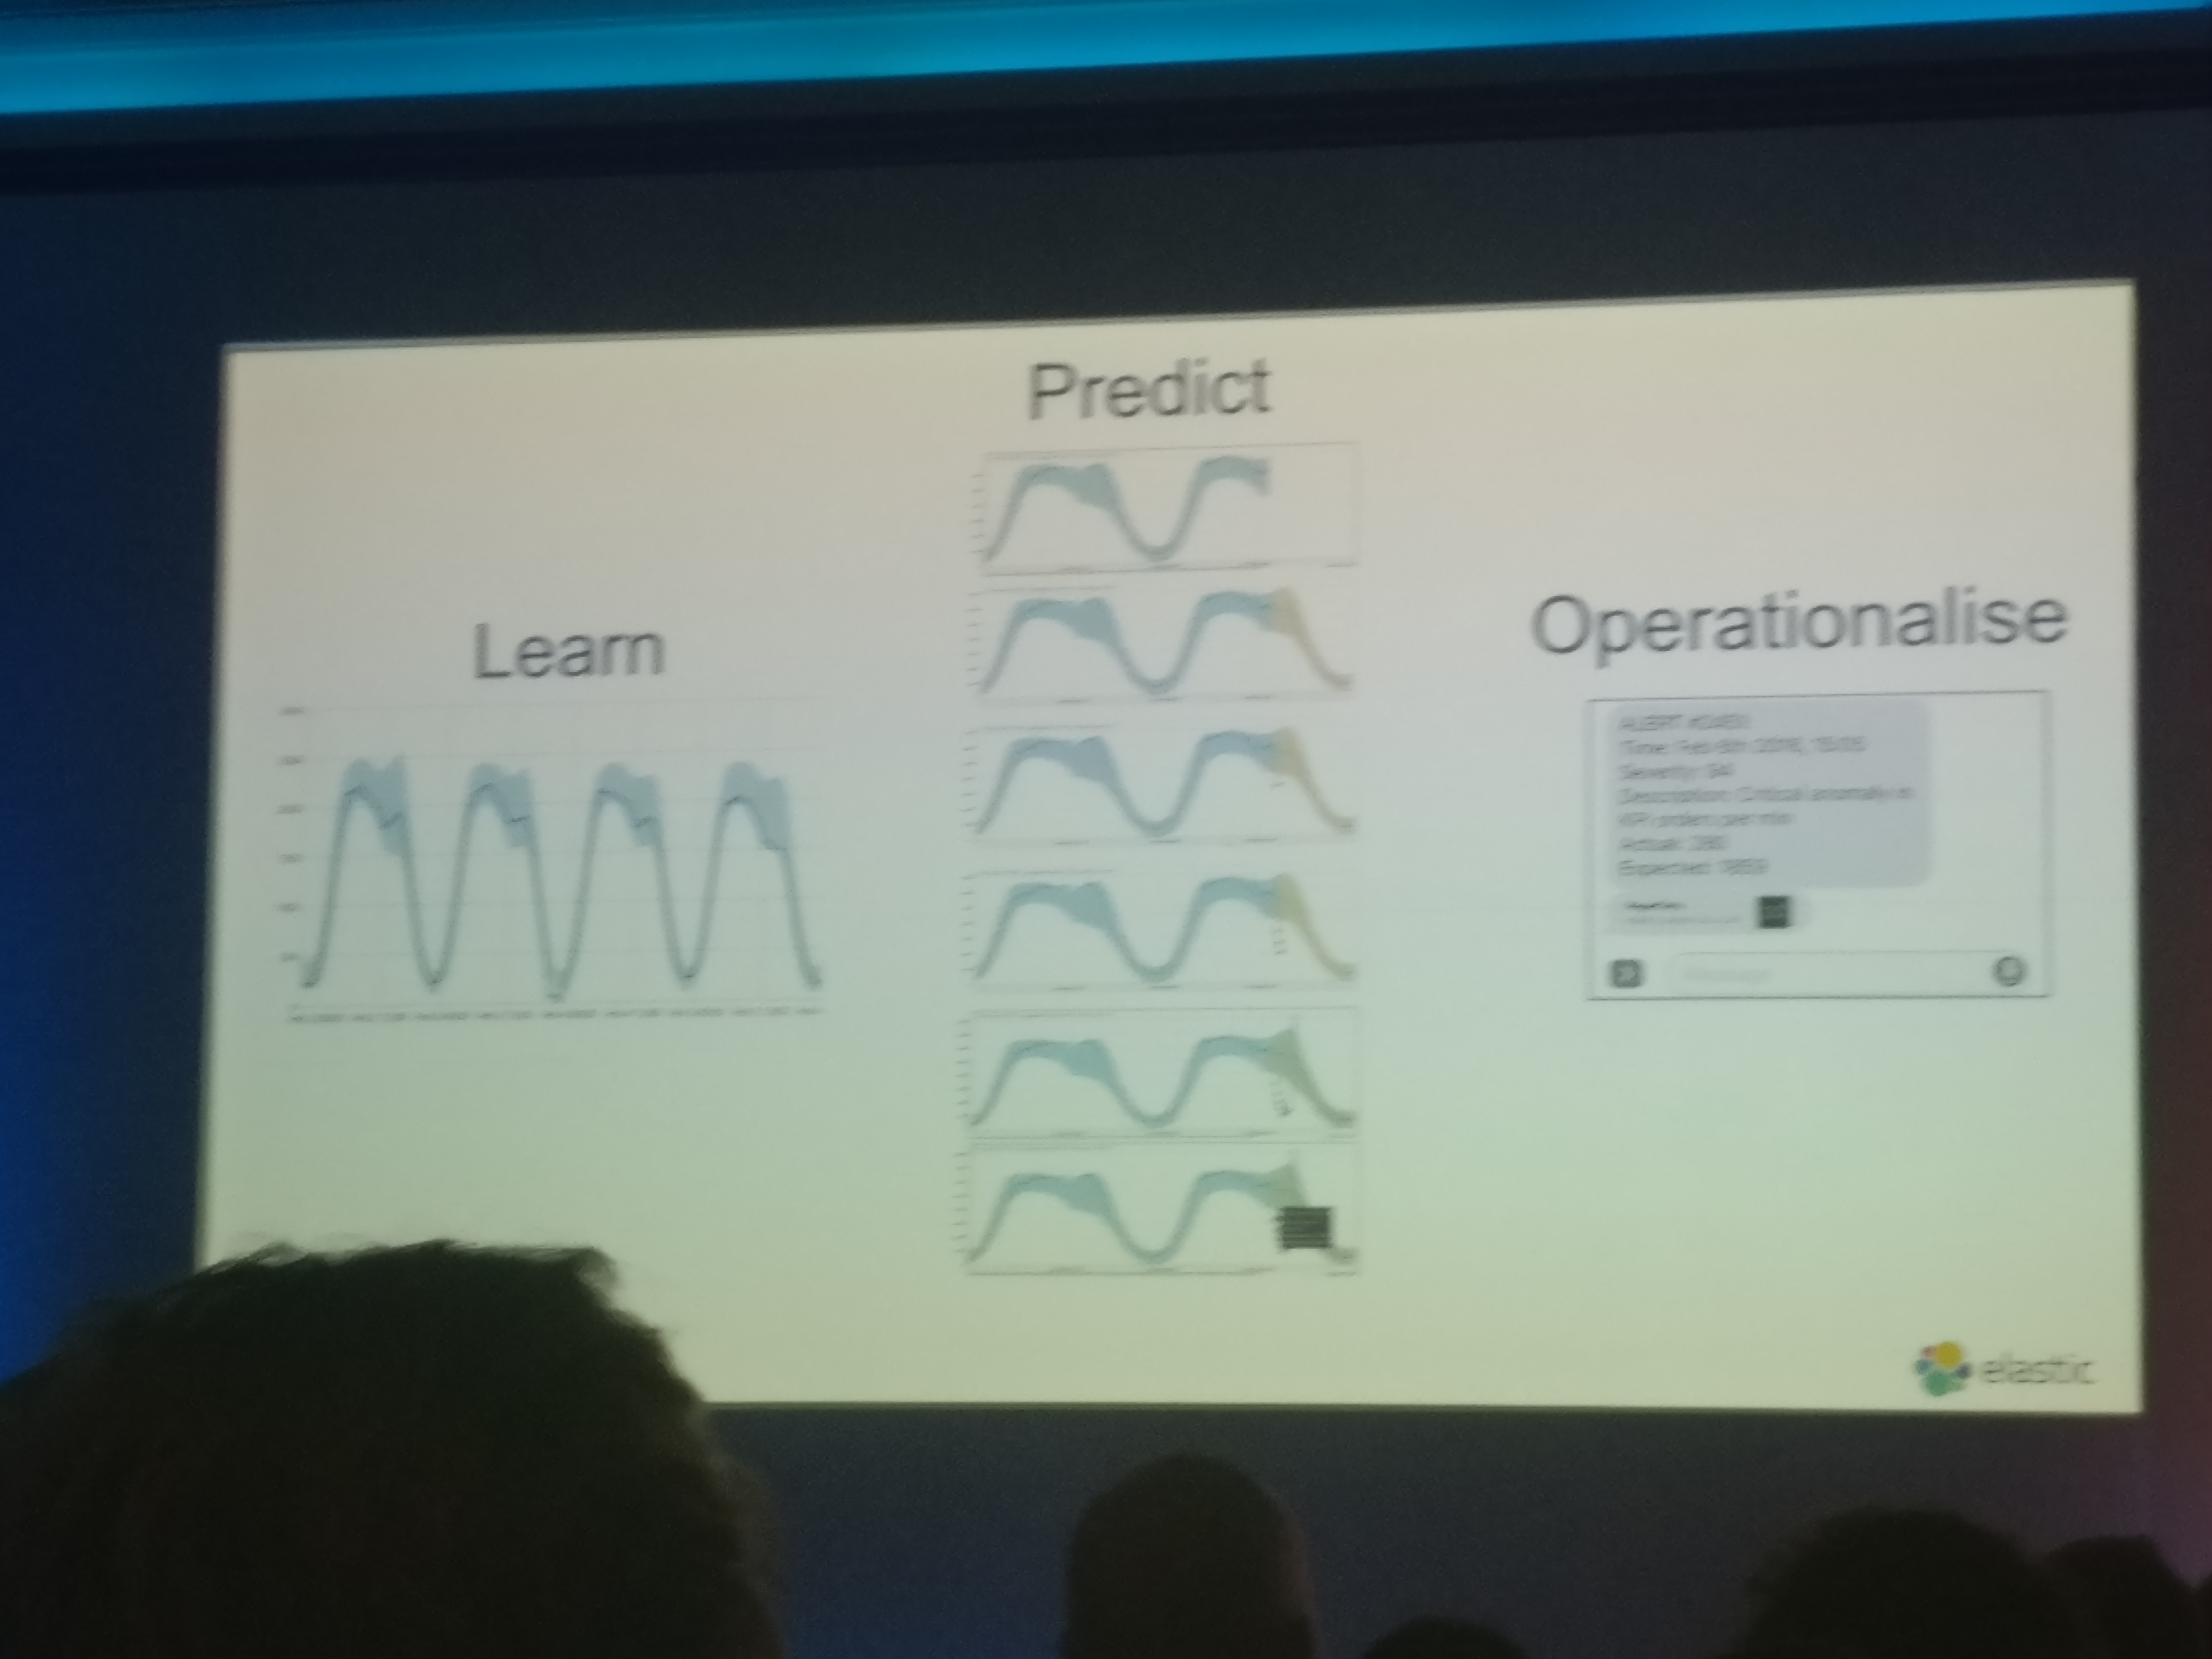
The Machine learning knowledgeable people, which I am not, will now be asking questions such as: how does it learn? what algorithms does it use? is it using x or y assumption in the predictions and many other. The answer to those questions is I not that sure. A few different words were mentioned, it used unsupervised ML over time series data to create the models and they are implementing things like change by detection and forecasting based on what the model predicted. But as of a month ago and is now implemented for elastic 6.3 (which is just around the corner) Elastic have opened up the code for all to see.
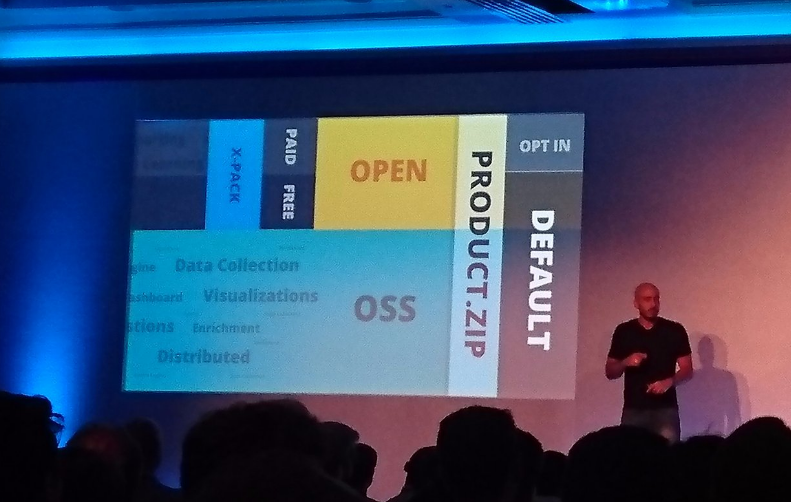
While the core elastic beats and kibana remain a true opensource product Elastic have added to all the repos all the xpack code that was once under lock and key like all proprietary applications are. You can now view on GitHub all the xpack code so for the ML experts you can see what they have implemented. (https://github.com/elastic/elasticsearch/tree/master/x-pack/plugin/ml/src/main/java/org/elasticsearch/xpack/ml/job , God I hate Java package naming scheme). Personally I not sure I like the idea of bundling proprietary code (note all the Xpack stuff requires a licence to use but the code is know open) into a opensource repo. I would have preferred it to be in its own repo clearly marked as closed source.
Other things mentioned during the conference:
One of them is Data Rollups where you may need to create High-level dashboards that need decades worth of data. But likely not decades worth of fine-grained data that takes up considerable disk space. Which will cost money to store so instead you get to pick all the fields you want rolled up and a new index is created with just the rolled-up data. This new rollup index then lives side by side with the index that it’s being rolled up from. Since rollups are just like any other index — only a lot smaller — you already know how to query and aggregate the data inside.
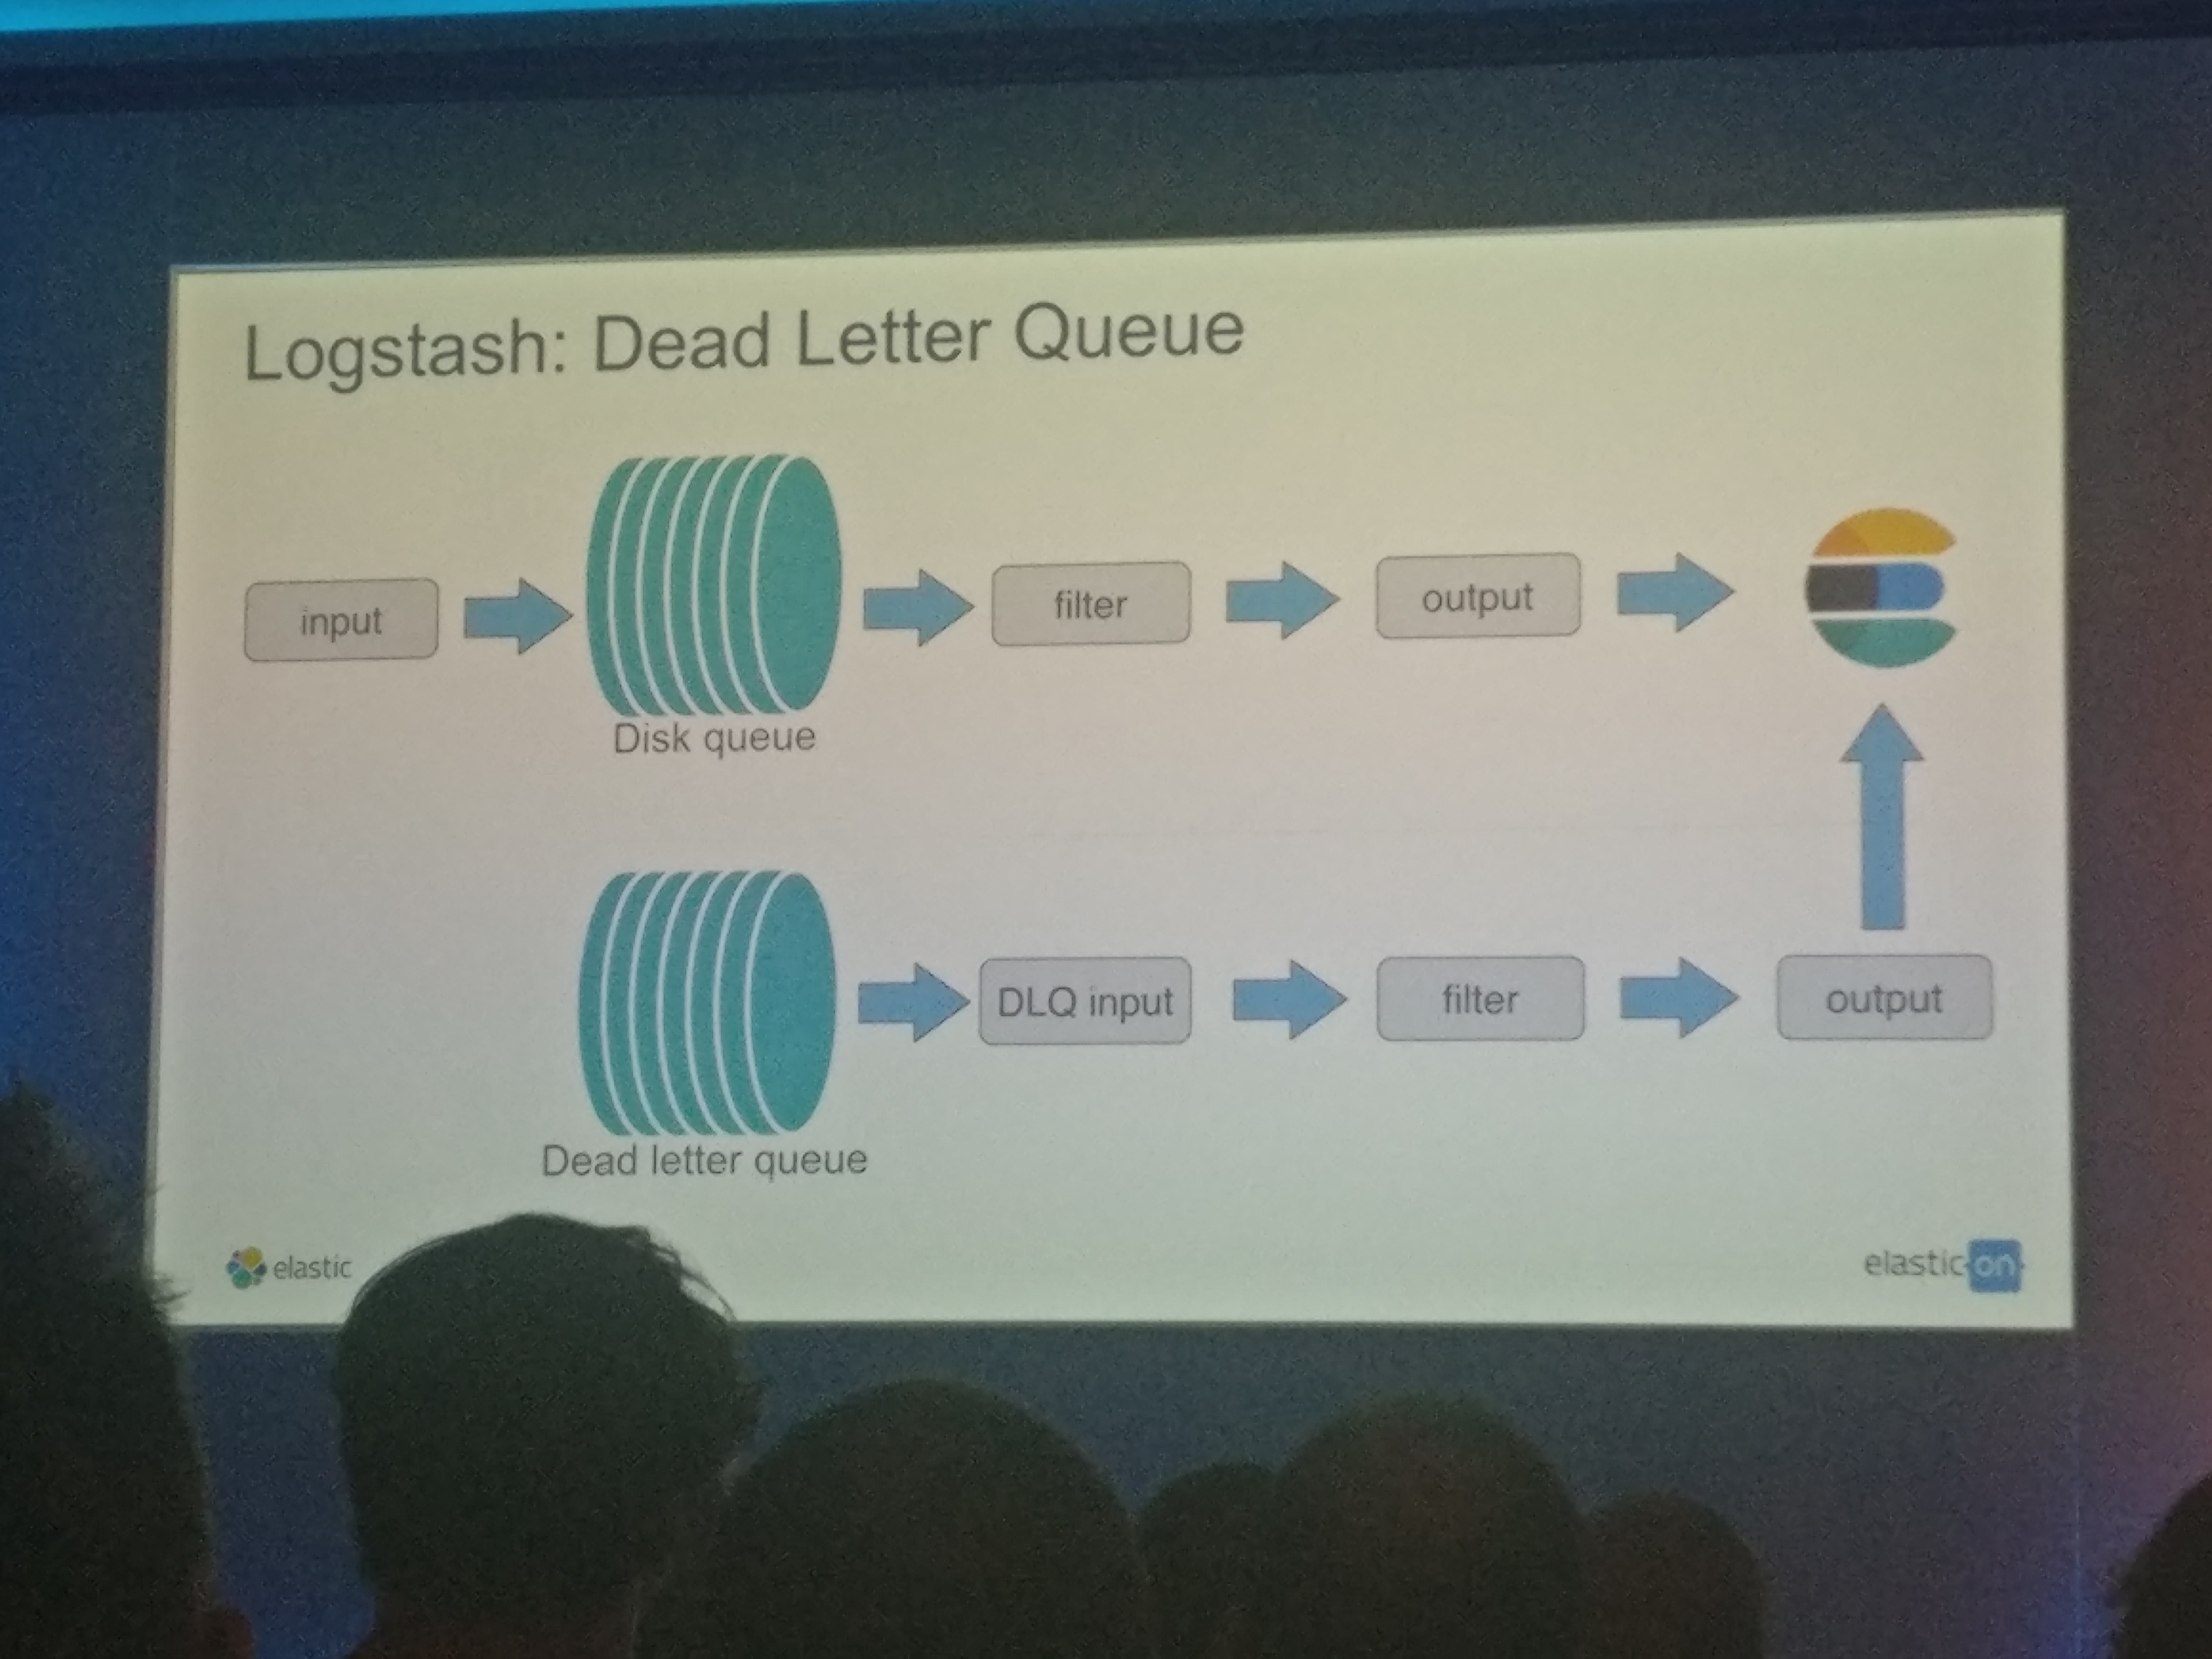
Since Data is important losing it can be terrible so now in Logstash and the beats tools Elastic have implemented disk queues that will store data on disk if it can not contact elastic. But when elastic reconnects that data store on the queue get replayed back into elastic.
There was talk about kibana canvas. A way to produce real time infographics. while I can see the uses for displays in public places maybe producing some flash stats for marketing or presentations it currently seems powerful but not really intuitive to use, Its not drag and drop theres a small amount of code to write in the kibana app to get the data into a visible form but It is interesting the ability to pull data from external apis to make the visualisation more powerful
There was an interesting talk from on of the solution architects about some of the pit falls during putting an elastic cluster into production and how to avoid it. One was the mapping used. there are a few useful settings that you can tell elastic to either index all data coming (dynamic true) it useful in development when you do not know the data. Setting dynamic to false will tell elastic to only index the set fields you tell it too but store all data. Or finally if you set dynamic to strict elastic will drop data that does not match exactly the mapping you give it. Other performance can be due to improper index sizes and partition shading but most of this can be found on elastic documentation
Overall a useful conference I also had a chat with some of the elastic staff at the QA booth with some questions about licensing which was very helpful. I leave with some interesting ideas off what I will experiment in the future.